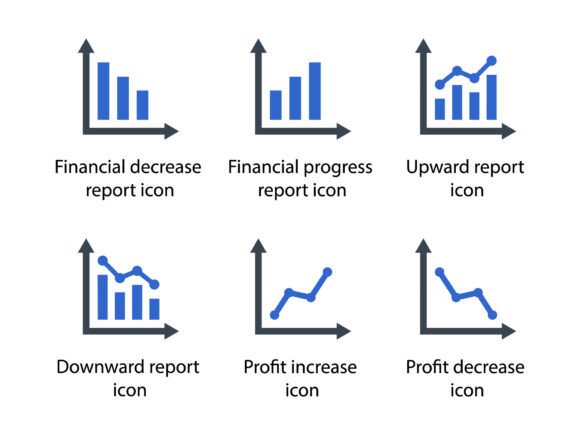
Business Graph Icon Set 1
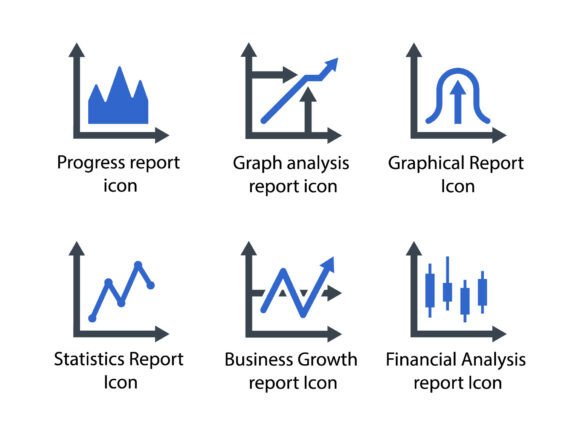
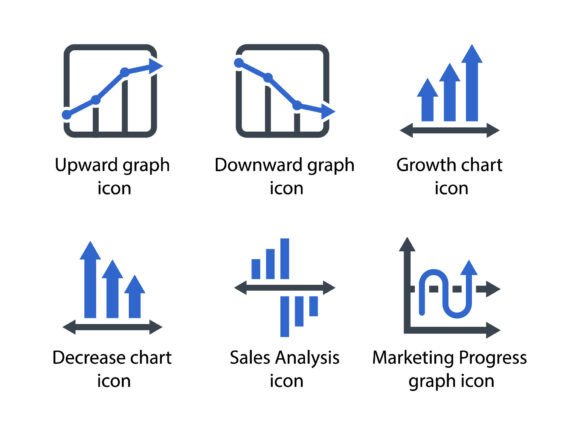
Business Graph Icon Set 1 is a collection of meticulously crafted glyphs designed to convey data, trends, and performance in a clear and professional manner. These icons are ideal for visual storytelling in a variety of design projects, from website layouts to printed materials and marketing collateral. Each icon is carefully drawn to maintain consistency while offering a unique visual identity that enhances the overall aesthetic of any project.
The set includes a range of icons such as decrease report, progress report, upward report, downward report, profit increase, and profit decrease. These icons are not just functional; they are also visually appealing, making them a valuable addition to any designer’s toolkit. The clean lines and balanced proportions ensure that each icon is both modern and timeless, fitting seamlessly into a wide array of design styles.
Visual Characteristics and Style
Business Graph Icon Set 1 features a minimalist yet sophisticated design language. The icons are primarily based on geometric shapes and simple strokes, which contribute to their clarity and readability. This style makes them particularly effective in contexts where information needs to be communicated quickly and efficiently.
The personality of the set is professional and reliable, making it well-suited for business-related applications. Whether you're designing a dashboard, a presentation, or a report, these icons can help reinforce the message you're trying to convey. Their subtle variations in line weight and shape add depth without overwhelming the viewer.
The visual appeal of the set lies in its balance between simplicity and detail. Each icon is designed with precision, ensuring that it maintains its integrity at different sizes and resolutions. This attention to detail makes Business Graph Icon Set 1 a versatile choice for both digital and print media.
Best Applications for Business Graph Icon Set 1
Business Graph Icon Set 1 is incredibly versatile, making it suitable for a wide range of creative and commercial projects. In web design, these icons can be used to represent data trends, financial performance, and project progress. They work well in dashboards, analytics pages, and infographics, where visual clarity is essential.
In branding and marketing, these icons can enhance the visual language of a company’s identity. They can be incorporated into logos, social media graphics, and promotional materials to create a cohesive and professional look. Their clean design ensures they remain relevant across different platforms and mediums.
For editorial and publishing projects, Business Graph Icon Set 1 adds a touch of sophistication to articles, reports, and presentations. They can be used to highlight key points, illustrate concepts, and guide the reader through complex information. Their versatility makes them a great choice for both print and digital publications.
Impact on Readability and Brand Perception
One of the key strengths of Business Graph Icon Set 1 is its ability to enhance readability. By using icons to represent data and trends, designers can make complex information more accessible and engaging. This is especially important in environments where users need to process large amounts of information quickly.
The consistent style of the icons also contributes to a strong visual hierarchy. When used effectively, they can help organize content, draw attention to important elements, and guide the viewer’s eye through the design. This makes them an excellent tool for creating structured and easy-to-navigate layouts.
From a brand perception standpoint, Business Graph Icon Set 1 conveys professionalism and reliability. The clean and modern design aligns with contemporary design trends, making it a great choice for businesses looking to establish a polished and trustworthy image. Consistency in icon usage also reinforces brand recognition, helping to build trust with the audience.
Choosing and Using Business Graph Icon Set 1
When selecting Business Graph Icon Set 1 for a project, consider the context and the message you want to communicate. For example, if you’re designing a financial report, the profit increase and decrease icons can be used to visually represent changes in revenue. In a project management setting, the progress and report icons can help track milestones and performance metrics.
Evaluating the fit of the set within your project involves testing different combinations and placements. Experiment with how the icons interact with other design elements, such as text, colors, and layouts. This will help ensure that they complement rather than compete with the overall design.
Testing font pairings is also important when using Business Graph Icon Set 1. While the icons themselves are static, they often work best alongside complementary typefaces. A sans serif font might provide a clean and modern contrast, while a serif font could add a touch of elegance and tradition.
Readability considerations should not be overlooked. Ensure that the icons are large enough to be easily recognizable, especially in digital formats. In print, pay attention to how they appear at different sizes and resolutions. High-quality files, such as EPS, SVG, and PNG, allow for flexibility in scaling and use across different platforms.
Commercial licensing is another factor to consider. Make sure that the license allows for the intended use, whether it's for personal, commercial, or multi-project purposes. Understanding the terms of use will help avoid any potential issues down the line.