Constructio Project Timeline Infographic: A Clear and Professional Way to Present Construction Schedules
The Constructio Project Timeline Infographic is a powerful visual tool designed to simplify complex construction schedules into clear, intuitive layouts. This resource is ideal for professionals who need to communicate project timelines effectively to stakeholders, planning teams, or technical audiences. By using this infographic, users can present their construction schedules with confidence, ensuring clarity and professionalism in all reports and presentations.
What Makes Constructio Project Timeline Infographic Distinct?
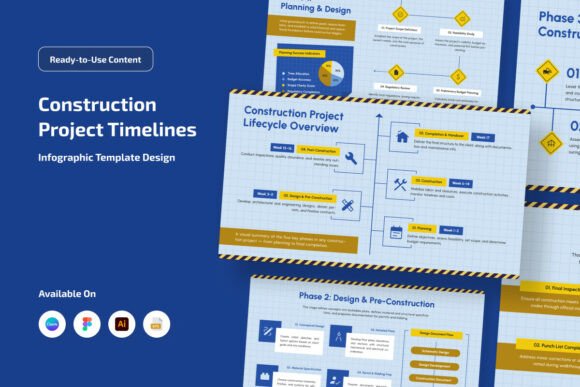
The Constructio Project Timeline Infographic stands out due to its bold, clean design and high visibility. It is specifically tailored for construction projects, making it easy to visualize the sequence of tasks, milestones, and deadlines. The infographic includes six different design variations, allowing users to choose the layout that best suits their needs and preferences.
One of the key features of this infographic is that it is fully layered and editable. This means users can customize text, colors, and objects to match their brand or project requirements. The ability to edit these elements makes the infographic versatile for various use cases, from internal planning to client presentations.
The file formats provided include Adobe Illustrator (.AI), EPS (.EPS), Figma (.FIG), Canva link (.TXT), and a Readme file. These options ensure compatibility with a wide range of design software, making it accessible to professionals with different technical backgrounds. Additionally, the use of free fonts ensures that the infographic remains visually appealing without requiring expensive font licenses.
How Does Constructio Compare to Other Options?
When compared to other timeline visualization tools, the Constructio Project Timeline Infographic offers a unique blend of simplicity and customization. While many digital project management tools provide interactive timelines, they often lack the visual appeal and print-ready quality that this infographic provides. For professionals who need a high-quality, printable version of their project schedule, Constructio is an excellent choice.
Other infographic templates may offer similar design styles, but few provide the same level of flexibility and editability as Constructio. Many alternatives are limited in terms of customization, forcing users to work within strict design constraints. In contrast, Constructio allows for full control over text, color, and layout, giving users the freedom to tailor the infographic to their specific needs.
For those who prefer digital tools, there are also online platforms that generate project timelines automatically. However, these tools often produce generic designs that may not align with a company’s branding or aesthetic preferences. The Constructio infographic, on the other hand, is built with a professional look that can be adapted to fit any style or theme.
Strengths and Best-Fit Situations
The Constructio Project Timeline Infographic excels in situations where clarity and visual appeal are essential. It is particularly useful for architects, builders, and designers who need to present structured construction data in a way that is easy to understand. Whether used in technical documentation, client meetings, or internal planning sessions, this infographic helps convey project details efficiently.
One of the main strengths of the Constructio infographic is its ability to break down complex timelines into digestible visuals. This makes it easier for stakeholders to grasp the overall project flow without getting lost in detailed schedules. The clean layout ensures that even non-technical audiences can follow the timeline with minimal confusion.
Another advantage is the variety of design options available. Users can choose from six different infographic variations, each suited for different types of projects or presentation styles. This flexibility makes the Constructio infographic a valuable asset for a wide range of construction-related tasks.
Tradeoffs and Limitations
While the Constructio Project Timeline Infographic offers many benefits, it is important to consider its limitations. For example, the infographic is primarily designed for static use, which means it may not be ideal for dynamic or real-time project tracking. Users who require interactive or automated timeline updates may need to combine this infographic with other digital tools.
Additionally, the level of customization available depends on the user's design skills. While the files are fully editable, some users may find it challenging to make significant changes without prior experience in graphic design software. However, the included Readme file provides guidance to help users navigate the editing process more easily.
It is also worth noting that the infographic uses RGB and 72dpi, which are standard for digital displays but may not be optimal for high-resolution printing. Users who plan to print the infographic should verify that the file settings meet their specific printing requirements.
When to Choose Constructio and When to Consider Alternatives
The Constructio Project Timeline Infographic is the right choice when a professional, visually appealing, and customizable timeline is needed for presentations, reports, or stakeholder communication. It is especially beneficial for projects that require a clear and structured visual representation of the construction schedule.
However, if a user needs real-time updates, interactive features, or more advanced project management capabilities, alternative tools may be more suitable. Digital project management platforms like Asana, Trello, or Microsoft Project offer dynamic task tracking and collaboration features that complement the static nature of the infographic.
For those who prioritize ease of use over customization, pre-designed templates from Canva or other online design tools may be a better fit. These platforms often allow users to create timelines with minimal design knowledge, though they may not offer the same level of polish or adaptability as the Constructio infographic.
Practical Use Cases
One practical use case for the Constructio Project Timeline Infographic is in client presentations. Architects and builders can use the infographic to clearly outline the phases of a construction project, helping clients understand the expected timeline and milestones. This can lead to better communication and alignment between the project team and the client.
Another common use is in internal planning meetings. Teams can use the infographic to track progress, identify potential delays, and ensure that all tasks are on schedule. The visual format makes it easier for team members to grasp the big picture and stay focused on their individual responsibilities.
In technical documentation, the Constructio infographic can serve as a reference guide for project managers and engineers. It provides a clear overview of the construction sequence, which can be useful for compliance, safety, and quality assurance purposes.